Introduction
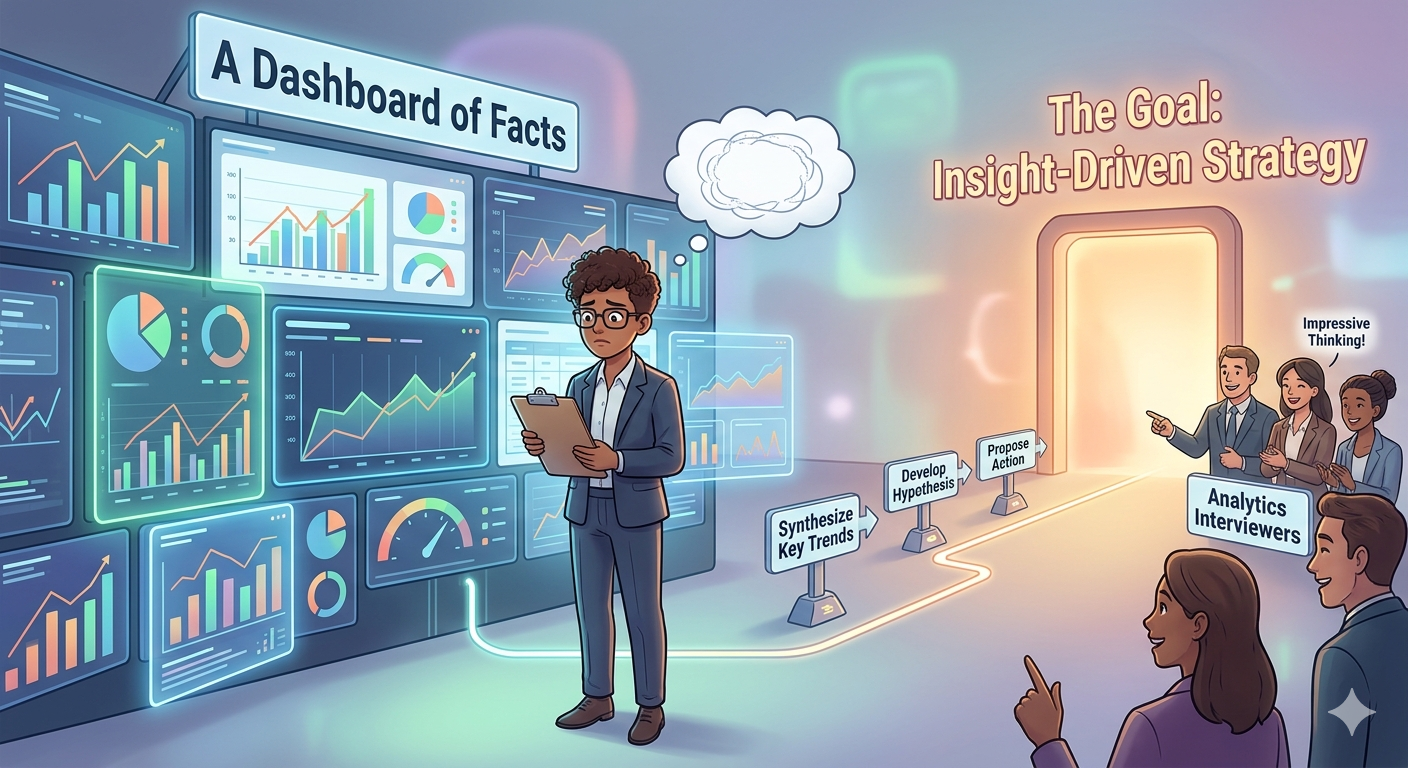
Dashboards are one of the most visible outputs in analytics work. Tools like Power BI, Tableau, and Looker make it easy to create attractive visual reports that summarize large datasets. Because of this, many candidates assume that building dashboards is enough to demonstrate strong analytical ability. However, during analytics interviews, employers evaluate much more than visualization skills. This explains why dashboards alone don’t impress analytics interviewers in modern hiring processes.
Dashboards show how data is presented, but interviewers want to know how candidates think, analyze, and interpret the data behind those visuals. Analytical reasoning and insight generation carry far more weight than presentation alone.
Dashboards show presentation, not analytical depth
Dashboards organize data into charts, graphs, and summary metrics. While this helps stakeholders view information quickly, it does not necessarily reveal how the analyst reached those insights.
Interviewers therefore ask candidates to explain the logic behind the dashboard. They want to understand how the data was cleaned, filtered, and analyzed before visualization.
Candidates who focus only on design elements may struggle to demonstrate deeper analytical thinking.
Employers value the problem-solving process
Analytics work begins with defining a problem, collecting relevant data, and analyzing patterns before creating reports. Dashboards represent only the final stage of this process.
During interviews, hiring managers want to hear how candidates approached the problem. They ask questions about assumptions, analytical methods, and reasoning.
Candidates who explain their thought process clearly demonstrate stronger analytical capability.
Data interpretation matters more than visuals
Visualizations make data easier to understand, but they do not automatically generate insights. Analysts must interpret patterns and explain their significance.
Interviewers often ask candidates what conclusions they drew from their dashboards and how those insights could influence decisions.
Candidates who connect visuals to meaningful business insights stand out more than those who simply showcase charts.
Understanding data sources is essential
Behind every dashboard lies a structured dataset. Analysts must understand how data is collected, cleaned, and transformed before visualization.
Recruiters often evaluate whether candidates understand database structures, SQL queries, and data preparation steps.
Candidates who rely only on dashboard tools without understanding data pipelines may appear less technically prepared.
Insight-driven thinking influences hiring decisions
Organizations hire analysts to solve business problems, not just to build reports. Therefore, interviewers focus on whether candidates can identify trends, anomalies, and opportunities within data.
Dashboards can highlight patterns, but analysts must explain why those patterns exist and what actions should follow.
Insight-driven thinking demonstrates real analytical value.
Ability to ask questions strengthens analysis
During analytics interviews, strong candidates often ask questions about the dataset, business goals, or assumptions behind the metrics.
These questions show curiosity and critical thinking. They also help refine the analysis and ensure insights align with business objectives.
Questioning ability demonstrates deeper engagement with data.
Storytelling transforms dashboards into insights
Dashboards become powerful when analysts explain the story behind the data. Storytelling connects visual patterns with business outcomes and strategic decisions.
Interviewers look for candidates who can guide stakeholders through insights step by step. This narrative approach shows that the analyst understands both the data and its business implications.
Storytelling turns dashboards into decision-making tools.
Analytical flexibility matters more than tool expertise
Analytics tools change frequently as new technologies emerge. However, analytical reasoning and problem-solving skills remain consistent.
Employers therefore prioritize candidates who demonstrate strong thinking rather than tool-specific knowledge.
Candidates who understand data relationships, patterns, and analytical methods adapt more easily to new platforms.
Real-world impact defines strong analytics work
The ultimate goal of analytics is to influence decisions. Dashboards alone cannot achieve this without interpretation and recommendations.
Interviewers evaluate whether candidates can explain how their analysis improved performance, solved problems, or supported strategy.
Candidates who highlight real-world impact demonstrate stronger professional readiness.
Conclusion
Dashboards remain valuable tools for visualizing and sharing data insights. However, visualization alone does not demonstrate full analytical capability. That is precisely why dashboards alone don’t impress analytics interviewers during hiring evaluations.
Employers look for professionals who can interpret data, ask meaningful questions, explain their reasoning, and connect insights to business decisions. By focusing on analytical thinking and problem-solving rather than visualization alone, candidates can demonstrate the deeper skills that organizations truly value in analytics roles.
Find Your Dream Job Today – Explore Endless Career Opportunities and Secure Your Next Role with Best Job Tool.


Leave a Reply